Targets
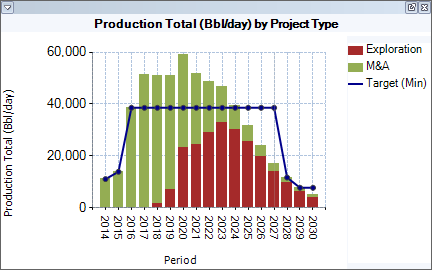
Targets are used as benchmarks for portfolio assessment and optimization. The image below shows an example of a target on a production chart. Both periodic and summary variables can be used as targets.
To show a target on a chart, right-click it and select Show Target. To hide the target line, click Show Target again. Targets of different types are shown in different colors. By default, minima are black and maxima are red. To change the color, right-click the target line on the chart, select the Colors and Markers option and choose a new color in the pop-up dialog.

Targets are set up in the configuration settings (see Periodic Variables and Summary Variables):
- Click the Edit Configuration button
 on the ribbon to open the Configuration window. Open the
Periodic Variables or Summary Variables tab, depending on which variable you want to use.
 - Select the variable and check its Is Target? box.
- Select whether the target is a minimum, maximum or range in the Target Type field.
- Save the changes. The new target will appear on the Set Targets tab.
- Open the Set Targets tab and specify the target values. Or, right-click the chart and select Data Management > Copy To Targets.
